Aggregate demand and supply curves have been widely used to analyze the performance of the macroeconomy. Figure 5-3 shows four diagrams that represent different changes in the macroeconomy. Choose the diagram that best represents the situations described in the following questions. Figure 5-3 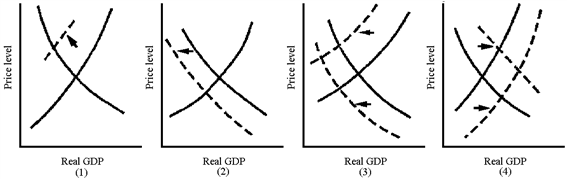
Which graph in Figure 5-3 best represents the favorable macroeconomy of the late 1990s?
Definitions:
Goods
Tangible products or items that satisfy human wants or needs and can be transferred from one person to another.
Product Market
The platform where end products or services are made available to individuals, companies, and the general public.
Households
Individuals or groups of people living together as a single unit, making economic decisions and consuming goods and services.
Factor Market
A marketplace for the services of a factor of production (e.g., labor, land, capital), where these services are bought and sold.
Q4: The public often overestimates the negative effects
Q84: Which of the following is not one
Q103: Does inflation always cause workers losses due
Q107: Taxes are not considered a leakage because
Q129: Equilibrium in a market is<br>A) a situation
Q149: GDP cannot be used for international comparisons
Q164: Macroeconomics stresses<br>A) resource allocation and income distribution.<br>B)
Q176: China is the world's largest wheat producer.
Q190: In 2008, you buy a 1967 Shelby
Q212: Business cycles in the United States after