Multiple Choice
Figure 8-2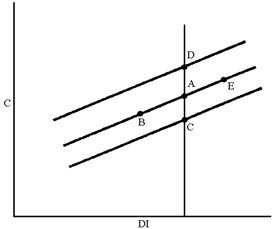
In Figure 8-2, which of the following moves can be explained by an increase in government transfer payments?
Definitions:
Related Questions
Q2: Table 9-1 <img src="https://d2lvgg3v3hfg70.cloudfront.net/TBX9029/.jpg" alt="Table 9-1
Q26: Over the past few decades, nominal interest
Q115: Full employment is defined by most economists
Q136: Retirement savings allows retirees to consume more
Q177: Which of the following groups would be
Q183: Figure 9-5<br><img src="https://d2lvgg3v3hfg70.cloudfront.net/TBX9029/.jpg" alt="Figure 9-5
Q188: If the expenditure schedule must be shifted
Q197: Which of the following would be most
Q210: A movement upward along the consumption function
Q223: Human capital is the amount of<br>A) capital