Multiple Choice
Figure 11-2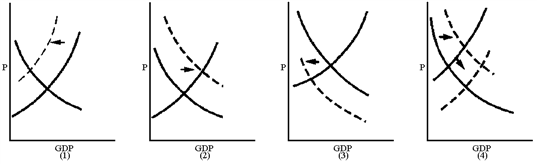
Which graph in Figure 11-2 best reflects a supply-sider's view of the impact of an increase in the personal income tax rate?
Definitions:
Related Questions
Q23: Suppose we observe an economy experience an
Q66: When income taxes are included in the
Q115: Commodity money is<br>A) backed by gold.<br>B) money
Q146: Figure 10-1<br><img src="https://d2lvgg3v3hfg70.cloudfront.net/TBX9029/.jpg" alt="Figure 10-1
Q151: Recessionary gap is the amount by which
Q159: Distinguish between a movement along the aggregate
Q171: The multiplier for changes in taxes is
Q179: Table 10-1 <img src="https://d2lvgg3v3hfg70.cloudfront.net/TBX9029/.jpg" alt="Table 10-1
Q205: Which of the following statements would appeal
Q213: Using aggregate demand and aggregate supply analysis,