Figure 19-1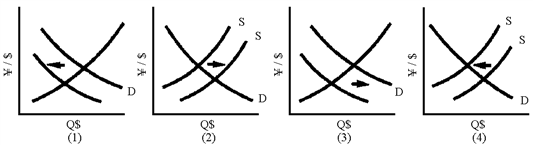
Of the graphs in Figure 19-1, which one shows that an expansion of the Japanese economy leads to a depreciation of the yen?
Definitions:
Q4: If actual inflation differs from expected inflation,
Q10: Appreciation is the term used to describe<br>A)
Q23: Figure 34-10<br><img src="https://d2lvgg3v3hfg70.cloudfront.net/TBX9029/.jpg" alt="Figure 34-10
Q46: Table 34-2 <img src="https://d2lvgg3v3hfg70.cloudfront.net/TBX9029/.jpg" alt="Table 34-2
Q105: Demand-side inflation is normally accompanied by<br>A) falling
Q116: If a country tries to stimulate the
Q116: Figure 33-8<br><img src="https://d2lvgg3v3hfg70.cloudfront.net/TBX9029/.jpg" alt="Figure 33-8
Q142: The intent of indexing is to<br>A) raise
Q162: Figure 36-7<br><img src="https://d2lvgg3v3hfg70.cloudfront.net/TBX9029/.jpg" alt="Figure 36-7
Q198: Adverse shocks such as the crop failures