Figure 6-2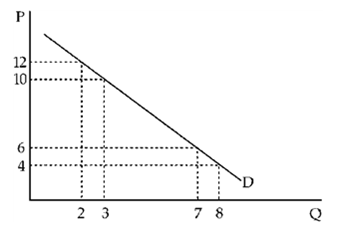
In Figure 6-2, the price elasticity of demand (dropping all minus signs) is ____ between P = 4 and P = 6 than between P = 10 and P = 12 because between the lower set of prices the percentage change in price is ____.
Definitions:
Supply Curves
Graphical representations showing the relationship between the price of a good and the quantity supplied.
Demand Curves
Demand curves graphically represent the relationship between the price of a good and the quantity demanded by consumers.
Minimum Wage
is the lowest legal salary that employers can pay workers, set by government law to protect workers from unduly low pay.
Price Support
Government intervention in a market to maintain the price at a certain level, usually done through the purchase of surplus stock or direct subsidies to producers.
Q1: The amount of a good sold in
Q9: What is the shape of a perfectly
Q26: Figure 5-11<br><img src="https://d2lvgg3v3hfg70.cloudfront.net/TBX9061/.jpg" alt="Figure 5-11
Q39: Suppose that Joan, the only consumer of
Q73: According to the "law" of demand, we
Q89: When economies of scale are present,<br>A)costs per
Q98: Suppose that elasticity has been reliably measured
Q110: A.B. Denson Company had been employing 6
Q179: The marginal rate of substitution represents the
Q188: If a household's income declines, then its