Multiple Choice
Figure 6-2 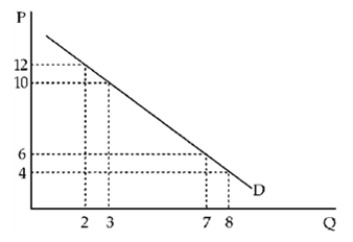
-Using Figure 6-2, calculate the price elasticity of demand (dropping all minus signs) between P = 10 and P = 12.
Definitions:
Related Questions
Q55: Table 7-5 <img src="https://d2lvgg3v3hfg70.cloudfront.net/TBX9061/.jpg" alt="Table 7-5
Q101: Draw individual demands for caviar for Al,
Q120: All straight-line demand curves have the same
Q145: Total expenditure equals price times elasticity.
Q146: Relative to the prices that would be
Q202: <img src="https://d2lvgg3v3hfg70.cloudfront.net/TBX9061/.jpg" alt=" In Figure 5-19,
Q204: If demand is elastic, an increase in
Q206: When using the terms "total utility" or
Q245: A rise in price will always result
Q297: A decrease in supply will have what