Figure 7-12 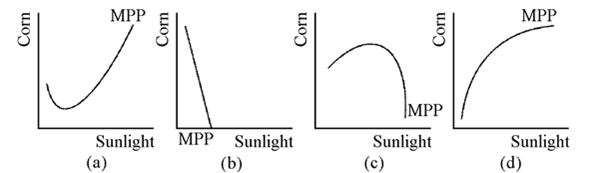
Which of the graphs in Figure 7-12 shows a marginal physical product curve that exhibits first increasing and then diminishing marginal returns to sunlight?
Definitions:
Q9: What is the shape of a perfectly
Q46: When a firm's AC eventually starts to
Q49: Bob values the utility of a single
Q60: Total profit is maximized where<br>A)MR = MC.<br>B)marginal
Q60: An accurate demand curve can be derived
Q132: Figure 7-15 <br><img src="https://d2lvgg3v3hfg70.cloudfront.net/TBX9061/.jpg" alt="Figure 7-15
Q142: Marginal revenue product is essentially the additional
Q161: <img src="https://d2lvgg3v3hfg70.cloudfront.net/TBX9061/.jpg" alt=" In Figure 5-18,
Q194: If fixed cost rises,<br>A)the profit-maximizing level of
Q259: Production costs for a given output will