Figure 13-3
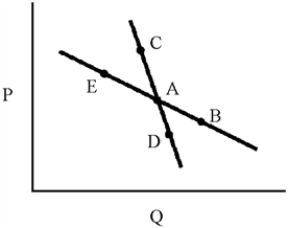
-In Figure 13-3, demand curve CAD represents a market in which oligopolists will match the price changes of rivals and demand curve EAB represents a market in which oligopolists will ignore the price changes of rivals.According to the kinked demand model, the relevant demand curve will be
Definitions:
Q3: Consider an industry consisting of four firms
Q57: A cartel is<br>A)a group of oligopolists who
Q101: If the smartphone market has only two
Q115: A natural monopoly is one that deliberately
Q132: We observe that the price per ounce
Q138: Most Americans would voluntarily support defense without
Q157: Many cities have summer pops series in
Q166: The factor that most often leads to
Q206: Explain why marginal revenue is less than
Q253: Which of the following characteristics of perfect