Multiple Choice
Figure 3-18 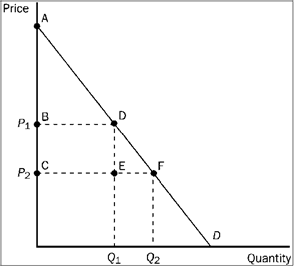
Refer to Figure 3-18. When the price falls from P 1 to P 2, which area represents the increase in consumer surplus to new buyers entering the market?
Definitions:
Related Questions
Q33: Use the figure below to answer the
Q128: Figure 3-15 <img src="https://d2lvgg3v3hfg70.cloudfront.net/TBX9057/.jpg" alt="Figure 3-15
Q142: Use the figure below to answer the
Q144: Figure 3-24<br><img src="https://d2lvgg3v3hfg70.cloudfront.net/TBX9057/.jpg" alt="Figure 3-24
Q188: If we observe long lines of people
Q217: If we observe an increase in the
Q235: Which of the following is NOT true
Q268: Figure 4-14 <img src="https://d2lvgg3v3hfg70.cloudfront.net/TBX9057/.jpg" alt="Figure 4-14
Q287: Use the figure below to answer the
Q369: If price falls, what happens to the