Use the figure below to answer the following question(s) .
Figure 4-7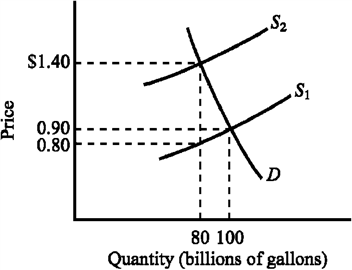
Refer to Figure 4-7. The supply curve S 1 and the demand curve D indicate initial conditions in the market for gasoline. A $.60-per-gallon excise tax on gasoline is levied, which shifts the supply curve from S 1 to S 2. Imposing the tax causes the equilibrium price of gasoline to increase from
Definitions:
Q14: Which of the following would tend to
Q38: Which of the following is a major
Q87: Use the figure below to answer the
Q101: If new regulations make it illegal to
Q102: The Laffer curve indicates that<br>A) when tax
Q119: The standard economists use to assess whether
Q175: Which of the following is most likely
Q193: Legislation that offers immediate and easily recognized
Q241: When the "invisible hand" guides economic activity,
Q555: Use the figure below to answer the