Use the figure below to answer the following question(s) .
Figure 4-7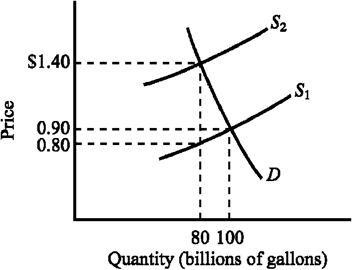
Refer to Figure 4-7. The supply curve S 1 and the demand curve D indicate initial conditions in the market for gasoline. A $.60-per-gallon excise tax on gasoline is levied. How much revenue does the $.60-per-gallon tax generate for the government?
Definitions:
Cash Flow Matching
A strategy of investing in such a way that cash flows from the investments will meet the investor's outflows when needed, often used in pension planning and managing corporate finances.
Active Bond Portfolio
A portfolio of bonds managed with the intention of outperforming the market through various strategies, such as sector rotation and duration management.
Financial Institutions
Entities that provide financial services, including banks, insurance companies, pension funds, brokerage firms, and others.
Realized Rate
The actual return earned on an investment over a given time period.
Q4: From the standpoint of economic efficiency, markets
Q49: The actual incidence of a tax<br>A) depends
Q59: People who receive the benefit of a
Q123: Figure 4-20 <img src="https://d2lvgg3v3hfg70.cloudfront.net/TBX9057/.jpg" alt="Figure 4-20
Q181: If a $2 tax per bottle of
Q241: Public choice theory indicates someone who spends
Q280: Figure 4-20 <img src="https://d2lvgg3v3hfg70.cloudfront.net/TBX9057/.jpg" alt="Figure 4-20
Q339: Which of the following refers to when
Q345: Which of the following is a distinguishing
Q432: Figure 3-20 <img src="https://d2lvgg3v3hfg70.cloudfront.net/TBX9057/.jpg" alt="Figure 3-20