Use the figure below to answer the following question(s) .
Figure 4-8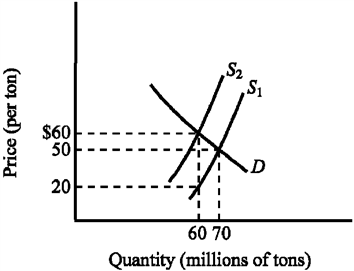
Refer to Figure 4-8. The supply curve S 1 and the demand curve D indicate initial conditions in the market for soft coal. A $40-per-ton tax on soft coal is levied, shifting the supply curve from S 1 to S 2. Imposing the tax increases the equilibrium price of soft coal from
Definitions:
Production Possibility Frontier
A graph showing the highest possible combinations of two goods that can be made using existing resources and technology.
Output Efficiency
The optimized state where goods or services are produced at the lowest possible cost and with the best allocation of resources.
Marginal Rate
The rate at which one variable changes with respect to a slight change in another variable, often used in the context of taxes or production.
Transformation
The process of changing the structure, appearance, or character of something, often seen in economic contexts as shifts in production or technology.
Q75: The more inelastic the demand for a
Q84: Which of the following provides an example
Q97: A special-interest issue is one that<br>A) allocates
Q102: Despite being a college graduate, Jack Adams
Q105: The idea that an action should be
Q117: Suppose external benefits are present in a
Q118: Figure 4-20 <img src="https://d2lvgg3v3hfg70.cloudfront.net/TBX9057/.jpg" alt="Figure 4-20
Q166: Markets fail to allocate resources efficiently when<br>A)
Q267: Figure 4-25 <img src="https://d2lvgg3v3hfg70.cloudfront.net/TBX9057/.jpg" alt="Figure 4-25
Q455: Which of the following is a function