Use the figure below to answer the following question(s) .
Figure 4-12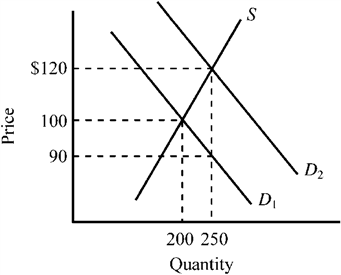
Refer to Figure 4-12. The supply curve S and the demand curve D 1 indicate initial conditions in the market for college textbooks. A new government program is implemented that grants students a $30 per textbook subsidy on every textbook they purchase, shifting the demand curve from D 1 to D 2. Which of the following is true for this subsidy given the information provided in the exhibit?
Definitions:
Debt Securities
Financial instruments representing a loan made by an investor to a borrower, typically involving periodic interest payments and the return of principal at maturity.
Held-to-maturity Securities
These are financial assets that a company has the intent and ability to hold until they mature.
Amortized Cost
The expense of an intangible asset over its useful life.
Investee
An entity in which an investor holds an interest, often evidenced by ownership of shares or securities.
Q16: Use the figure below to answer the
Q31: When a nuclear-powered electrical plant is permitted
Q88: When a government subsidy is granted to
Q122: Driving your automobile in Los Angeles during
Q156: Suppose that a tax is placed on
Q174: Adam Smith's invisible hand principle stresses<br>A) that
Q185: Figure 4-16 <img src="https://d2lvgg3v3hfg70.cloudfront.net/TBX9057/.jpg" alt="Figure 4-16
Q268: Figure 4-14 <img src="https://d2lvgg3v3hfg70.cloudfront.net/TBX9057/.jpg" alt="Figure 4-14
Q286: Figure 4-24 <img src="https://d2lvgg3v3hfg70.cloudfront.net/TBX9057/.jpg" alt="Figure 4-24
Q306: Suppose that the federal government levies a