Use the figure below to answer the following question(s) .
Figure 6-2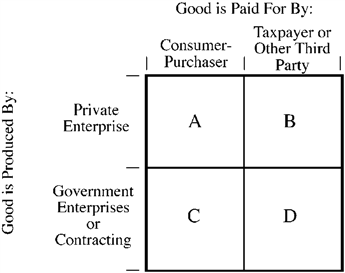
Figure 6-2 illustrates the four possibilities of the structure of production and consumption for a good or service. When the structure of production and consumption for a good places it in quadrant B,
Definitions:
Q15: Of all government spending in the United
Q16: Use the figure below to answer the
Q20: Use the figure below illustrating the impact
Q37: As methods of economic organization, the market
Q77: If most businesses in an industry are
Q96: Which of the following would be a
Q112: If the price of apples increases, total
Q125: Figure 7-7 <img src="https://d2lvgg3v3hfg70.cloudfront.net/TBX9057/.jpg" alt="Figure 7-7
Q131: Figure 4-21 <img src="https://d2lvgg3v3hfg70.cloudfront.net/TBX9057/.jpg" alt="Figure 4-21
Q313: Use the figure below to answer the