The figure below illustrates the cost and revenue structure for a monopoly firm.
Figure 11-17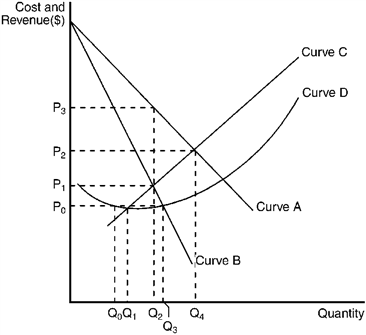
Refer to Figure 11-17. The average total cost curve for a monopoly firm is depicted by curve
Definitions:
Differentiation Focus Strategy
A business strategy where a company targets a specific market segment, offering unique products or services to stand out from competitors.
Cost Leadership Strategy
A generic business strategy that focuses on reducing expenses and, in turn, lowers product prices while targeting a broad array of market segments.
Reducing Expenses
Refers to actions taken by individuals or businesses to decrease their costs or spending in various areas to improve financial health or increase profitability.
Market Segments
Subsets of a market made up of people or organizations with one or more characteristics that cause them to demand similar products.
Q38: Which of the following statements is correct?<br>A)
Q61: Which of the following is most likely
Q97: In some industries where firms experience declining
Q105: A competitive car wash currently hires 4
Q110: Which of the following is a term
Q130: Figure 11-18 <img src="https://d2lvgg3v3hfg70.cloudfront.net/TBX9057/.jpg" alt="Figure 11-18
Q131: The marginal revenue curve lies below the
Q135: Suppose a market is initially competitive with
Q156: If marginal cost exceeds marginal revenue, a
Q182: Which of the following would tend to