The figure below illustrates the cost and revenue structure for a monopoly firm.
Figure 11-17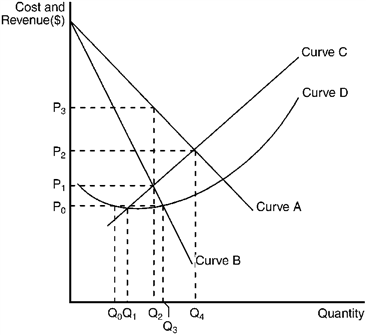
Refer to Figure 11-17. If the monopoly firm is currently producing Q3 units of output, then a decrease in output will necessarily cause profit to
Definitions:
Price
The expenditure needed to secure a product, service, or piece of property.
Price-discriminating Monopolist
A monopolist that sells the same product at different prices to different groups of consumers, usually to maximize profits by capturing consumer surplus.
Market
A place or mechanism through which buyers and sellers interact to trade goods, services, or assets, facilitating the determination of prices and the exchange of ownership.
Price Elasticity
An indicator of the sensitivity of consumer demand for a product to variations in its price, reflecting how significantly the amount of the product consumers want to buy alters with price adjustments.
Q8: When an entrepreneur introduces a new improved
Q38: The fact that barriers to entry are
Q98: Assume that skilled labor costs twice as
Q100: The additional amount a person is willing
Q104: If a firm used only two factors
Q114: Most of the income of Americans comes
Q146: In essence, patents grant their owners<br>A) a
Q180: Which of the following characteristics is true
Q224: In a small, isolated town in a
Q256: Use the figure to answer the following