The figure below illustrates the cost and revenue structure for a monopoly firm.
Figure 11-17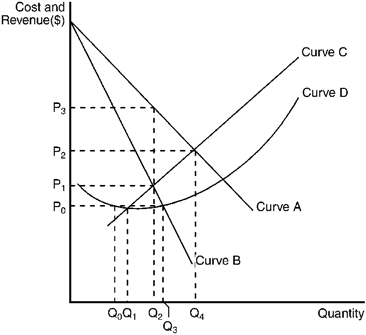
Refer to Figure 11-17. If the monopoly firm wants to maximize its profit, it should operate at a level of output equal to
Definitions:
Volume-Related Measures
Metrics that determine the effects of production or sales volume changes on costs and revenues.
Overhead Costs
Expenses not directly tied to the production of goods or services, like rent, utilities, and administrative costs.
Allocation Method
A procedure used in accounting or budgeting to distribute costs or revenues among various accounts or departments based on predetermined criteria.
ABC Perspective
An ABC Perspective generally refers to viewing activities based on Activity-Based Costing, focusing on managing activities as the route to optimizing costs and improving business operations.
Q8: Which of the following best explains why
Q27: Economic theory suggests that the standard of
Q37: The following schedule shows how many jars
Q54: The net present value of $1,000 received
Q85: The real rate of interest is the<br>A)
Q94: Which of these are the major sources
Q116: If coal and oil are substitute inputs
Q119: Which of the following indicates why the
Q228: An organization of sellers designed to coordinate
Q401: Figure 9-15 <img src="https://d2lvgg3v3hfg70.cloudfront.net/TBX9057/.jpg" alt="Figure 9-15