Exhibit 17-2 Aggregate demand and aggregate supply curves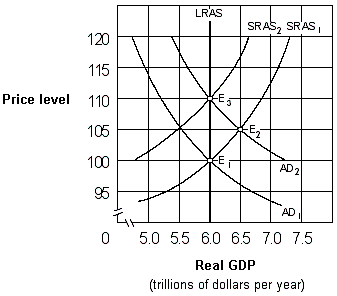
As shown in Exhibit 17-2, if people behave according to adaptive expectations theory, an increase in the aggregate demand curve from AD1 to AD2 will cause the economy to move:
Definitions:
Equilibrium Price
The price at which the quantity of goods supplied equals the quantity of goods demanded in a market, leading to market stability.
Equilibrium Quantity
The quantity of goods or services supplied and demanded at the equilibrium price.
Demand Equation
A mathematical representation that describes the relationship between the quantity of a good or service demanded and its price, along with other factors like income and prices of related goods.
Supply Equation
A mathematical representation of the relationship between the quantity of a good supplied by producers based on various factors, including price.
Q2: Economic growth is<br>A) cannot be illustrated by
Q2: At the unique point of consumer equilibrium,
Q7: Under adaptive expectations theory, an increase in
Q13: The study of the decision-making process of
Q29: Suppose Sam buys a good for $100
Q35: According to Adam Smith, what is the
Q44: Suppose George's income is $10,000 and he
Q61: If the slope of the indifference curve
Q108: If the opportunity cost of producing cheese
Q144: Exhibit 6A-5 Consumer Equilibrium<br><br><img src="https://d2lvgg3v3hfg70.cloudfront.net/TBX8793/.jpg" alt="Exhibit 6A-5