Exhibit 17-2 Aggregate demand and aggregate supply curves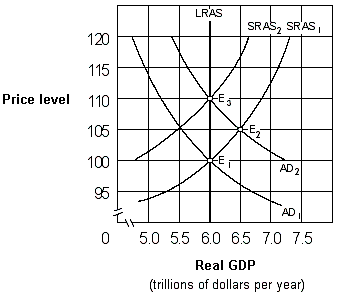
As shown in Exhibit 17-2, if people behave according to adaptive expectations theory, an increase in the aggregate demand curve from AD1 to AD2 will cause:
Definitions:
Zoning Ordinance
Regulations set by local governments determining how land within their jurisdiction can be used, affecting the development and use of properties.
Occupancy
Occupancy refers to the use or inhabitance of a space, such as a building or land, typically governed by legal or contractual terms.
Apartments
Residential units within a building or complex, typically available for rent, that consists of living space including bedrooms, a kitchen, and a bathroom.
Statute of Frauds
A legal principle that requires certain contracts to be in writing and signed by the parties involved, to be enforceable.
Q15: Does government borrowing crowd out private sector
Q27: Exhibit 10A-1 Aggregate demand and supply
Q29: The cost to a member bank of
Q50: Supply-side economists:<br>A) saw influence beyond in both
Q54: Jan has an income of $30,000 and
Q89: Assume the economy is operating at a
Q108: Exhibit 15-5 Balance sheet of Tucker National
Q113: The main explanation for why the cheap
Q125: Exhibit 3A-1 Comparison of Market Efficiency and
Q141: Exhibit 16A-2 Macro AD/AS Models<br><br><img