The following graph shows U.S. demand for and domestic supply of a good. Suppose the world price of the good is $1.00 per unit and a specific tariff of $0.50 per unit is imposed on each unit of imported good. In such a case, the government revenue from a tariff of $0.50 per unit is represented by the area _____.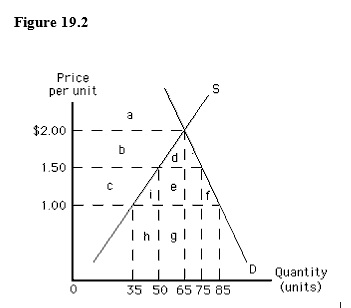
Definitions:
Current Profits
The earnings that a company or individual realizes during a specific period, primarily focusing on the present or most recent fiscal period.
Interest Rates
The cost of borrowing money or the compensation for the service and risk of lending money, typically expressed as a percentage.
Random Walk Theory
A theory in finance suggesting that stock market prices evolve according to a random walk and thus cannot be predicted.
Inefficient Market Theory
The theory that asserts markets are not always perfectly efficient, meaning not all available information is always fully reflected in asset prices.
Q5: The early Phillips curve showed a trade-off
Q9: Poor economies tend to have high education
Q10: The United States Agency for International Development
Q26: Many people prefer debit cards to checks
Q27: The balance of payments is also called
Q28: The following image shows the market for
Q66: If an economy is at potential GDP
Q78: The current account reflects:<br>A) trade in only
Q104: Other things constant, an increase in the
Q147: If a country has an absolute advantage