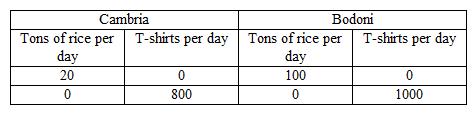
The following table shows per-day production data of rice and T-shirts for two countries, Cambria and Bodoni. Based on the table, it can be said that Bodoni has a comparative advantage in the production of rice.
Definitions:
Measures of Dispersion
Statistical indicators that describe the spread or variability of a data set.
Mode
The value that appears most frequently in a given set of data.
Range
The difference between the highest and lowest values in a dataset, providing a measure of data dispersion.
Variance
A statistical measure that quantifies the spread or dispersion of a set of data points around their mean value.
Q19: The International Monetary Fund providing assistance to
Q24: If an economy's actual GDP exceeds its
Q48: Which of the following is an outcome
Q76: Countries with a high level of human
Q90: For the newly industrialized countries of East
Q106: If an active approach is followed in
Q109: A country's investment earnings from foreign assets
Q111: Retaliation of trade restrictions can:<br>A) set off
Q116: The law of comparative advantage says that:<br>A)
Q148: All other things constant, if the interest