The following graph shows the demand for and the supply of a good in a country. If the world price of the good is $2.00 per unit and an import quota of 50 units per month is imposed, then the decrease in consumer surplus can be represented by the area _____.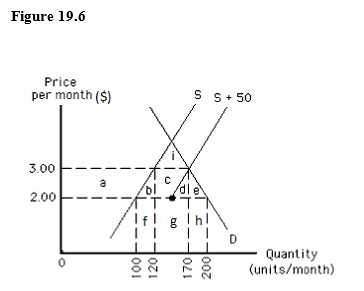
Definitions:
Order
A request by a customer or company to purchase goods or services, often formalized through a purchase order document.
Ledger
A book or collection of accounts in which account transactions are recorded, categorized by account type, and used to prepare financial statements.
Normal Balances
The typical balance sides (debit or credit) for different types of accounts in accounting, determining how increases or decreases are recorded.
Accumulated Depreciation
Accumulated depreciation represents the total amount of depreciation expense that has been recorded against a fixed asset over its useful life to reflect its loss of value.
Q5: Which of the following is true of
Q10: The table below shows the balance sheet
Q59: Suppose checking deposits increase by $6,000 after
Q81: The following graph shows U.S. demand for
Q99: The table below shows the balance sheet
Q103: The figure below shows the price level,
Q109: The higher the required reserve ratio, _.<br>A)
Q136: Adaptive expectations is a school of thought
Q141: Which of the following is the fundamental
Q144: Domestic producers of goods who compete with