Multiple Choice
Exhibit 4-4 Supply and demand curves for good X 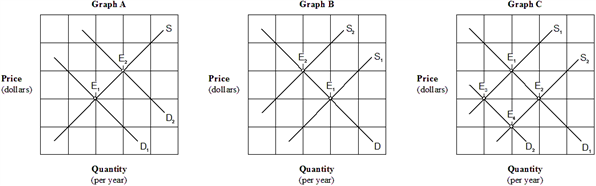 An increase in the wage rate paid to workers producing good X would be represented by which of the graphs in Exhibit 4-4?
Definitions:
Related Questions
Q3: An increase in the number of producers
Q32: Exhibit 4-7 Demand and supply schedules for movie
Q64: Which of the following is an example
Q76: In economics, investment refers to the process
Q105: The law of demand states that, ceteris
Q111: If the market price is below the
Q132: Demand price elasticity measures:<br>A) how much supply
Q200: A supply curve:<br>A) has a negative slope.<br>B)
Q255: Price floors typically improve market efficiency.
Q340: Which of the following goods are most