Multiple Choice
Exhibit 5-9 Supply and demand curves for good X 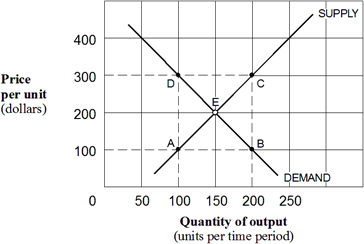 As shown in Exhibit 5-9, the price elasticity of demand for good X between points E and B is:
Definitions:
Related Questions
Q3: Exhibit 6-8 Costs schedules for producing pizza <img
Q7: If the demand for a product is
Q44: How would a decrease in consumer income
Q47: Exhibit 7-11 A firm's cost and marginal revenue
Q78: Suppose an oil company wants to make
Q82: If a good gives rise to substantial
Q101: Interpret what an increase in demand and
Q126: Economists say that a firm has a
Q204: In the short-run, total fixed costs always
Q231: Suppose a wallet firm has been dumping