Exhibit 1A-10 Multi-curve graph 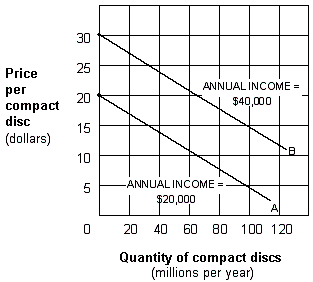
Exhibit 1A-10 represents a three-variable relationship. As the annual income of consumers rises from $20,000 (line A) to $40,000 (line B) , the result is a:
Definitions:
Ownership Interest
Represents the percentage of an entity owned by a specific investor or shareholders.
Equity Method
An accounting technique used to record investments in which an investor has significant influence but does not have majority control, representing the investment's value based on the investor's share of the investee's equity.
Open Market
A system where securities, commodities, or currencies are traded freely between buyers and sellers, with prices based on supply and demand.
Common Shares
Equity securities that represent ownership in a company, entitling holders to a share of the corporation's profit via dividends and voting rights.
Q1: All dark matter in our Universe falls
Q20: Exhibit 4-10 Supply and demand data
Q32: The evolution of the distribution of dark
Q36: Astronomers refer to elements heavier than helium
Q38: The production possibilities curve for the nation
Q46: Exhibit 2-6 Production possibilities curve data
Q55: Natural selection is random.
Q70: A detached segment of a spiral arm
Q91: The amount of a good that must
Q96: If the amount of time spent procrastinating