Multiple Choice
Use the figure below to answer the following question(s) . Figure 3-3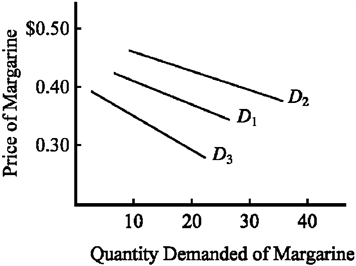 In Figure 3-3, if the initial demand for margarine were D1, the impact of a decrease in the price of butter, a substitute good for margarine, would be illustrated as
Definitions:
Related Questions
Q5: When private ownership rights are well-defined and
Q34: If there is a decrease in both
Q51: When there is reason to think that
Q54: Use the figure below to answer the
Q129: Figure 2-9 <img src="https://d2lvgg3v3hfg70.cloudfront.net/TBX9063/.jpg" alt="Figure 2-9
Q133: Competitive markets generally give consumers and producers
Q185: The economic principle that states that individuals
Q212: The more inelastic the demand for a
Q243: Which of the following will reduce the
Q294: A decrease in the price of leather