The following graph shows the actual percentage of U.S. households with a computer as a function of household income (the data points) and a logistic model of these data (the curve) . The logistic model is 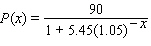 where
where  is the household income in thousands of dollars. For low incomes, the logistic model is approximately exponential. Which exponential model best approximates
  for small
  ? Round the coefficients to the nearest hundredth.
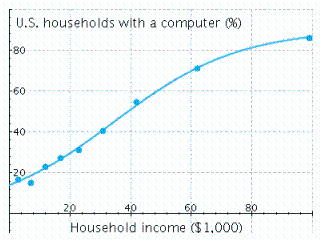
Definitions:
Q1: Calculate the limit algebraically. <img src="https://d2lvgg3v3hfg70.cloudfront.net/TBX8650/.jpg" alt="Calculate
Q8: All prototype chains ultimately find their source
Q11: The velocity of a particle moving in
Q27: Calculate <img src="https://d2lvgg3v3hfg70.cloudfront.net/TBX8650/.jpg" alt="Calculate .
Q28: For the following demand equation, find the
Q45: Write a note on nested functions.
Q48: Model the data using an exponential function
Q54: To create a custom object as an
Q83: There are currently 1,000 cases of Venusian
Q96: The following table shows the approximate average