Multiple Choice
Exhibit 11-3 Consider the General Phase Diagram shown below to answer the following problem(s) . 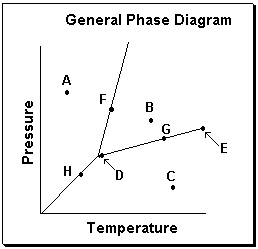
-Refer to Exhibit 11-3. What temperature-pressure point on the General Phase Diagram above represents the Critical Point ?
Definitions:
Related Questions
Q38: The following table of data was obtained
Q40: Consider the reaction of sodium metal with
Q52: Osmosis measures the natural tendency for two
Q55: Exhibit 11-2 The phase diagram below is
Q56: In which of the following molecules does
Q60: For which of the samples listed below
Q102: Glacial acetic acid, HC<sub>2</sub>H<sub>3</sub>O<sub>2</sub>, is 99.8% (m/m).
Q110: What is the bonded atom lone pair
Q115: Calculate the osmotic pressure at 298 K
Q193: The reaction of chlorine and water vapor