Multiple Choice
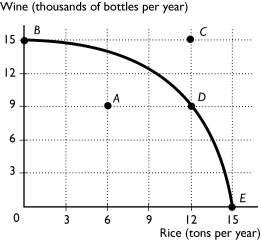
-The above figure shows the production possibility frontier for a country.Suppose the country is producing at point D.What is the opportunity cost of increasing the production of rice to 15 tons?
Definitions:
Related Questions
Q27: Which of the following statements is correct?<br>A)
Q54: In the above,which figure(s)show(s)a relationship between the
Q68: The downward slope of a demand curve<br>A)
Q73: If Tom can wax a car in
Q103: Physical capital differences across countries can be
Q117: The functional distribution of income measures which
Q120: Suppose the relationship between a person's age
Q160: People come to expect that the price
Q264: In the above figure,which of the figures
Q271: A graph shows the wage rate of