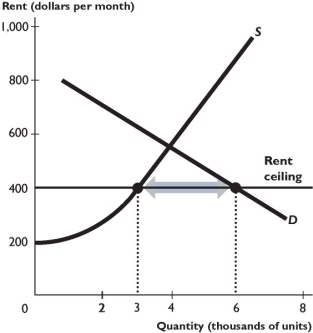
The figure above shows the supply and demand curves in the market for rental housing. A rent ceiling is set at $400 per month.
-In the figure above,with the rent ceiling the quantity of housing supplied is ________ units,the quantity demanded is ________ units,and the quantity rented is ________ units.
Definitions:
Insomnia
A sleep disorder characterized by difficulty falling asleep, staying asleep, or experiencing restful sleep.
Experiencing Insomnia
The condition of regularly having difficulty falling asleep or staying asleep, leading to poor sleep quality or quantity.
Rested
The state of having restored energy or fatigue relief after a period of rest or sleep.
Social-Cognitive Explanation
An approach in psychology that emphasizes the role of cognitive processes in understanding social behavior.
Q43: If a tariff is imposed on imports
Q44: A tariff is<br>A) a tax imposed on
Q68: Suppose the elasticity of supply of land
Q91: The above figure shows a housing market
Q102: To a seller,the cost of a good
Q127: When a tax is imposed on a
Q186: Which of the following is true? When
Q203: If the quantity of housing demanded _
Q232: The supply curve is the same as
Q345: The idea of the "big tradeoff" points