Multiple Choice
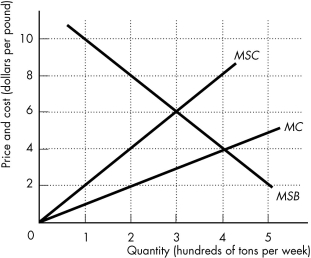
-The above figure shows the marginal private cost curve,marginal social cost curve,and marginal social benefit curve for cod,a common resource.The market equilibrium with no government intervention is ________.
Definitions:
Related Questions
Q27: In the United States,of all types of
Q82: In the market for automobile insurance,adverse selection
Q90: The United States imports cheese from a
Q99: Which of the following is not a
Q99: Marginal social cost is the<br>A) price a
Q138: Suppose that you consume only pizza,which costs
Q173: If the marginal social cost of a
Q185: Which of the following is a common
Q285: If a consumer's marginal rate of substitution
Q292: "External benefits lead to overproduction so that