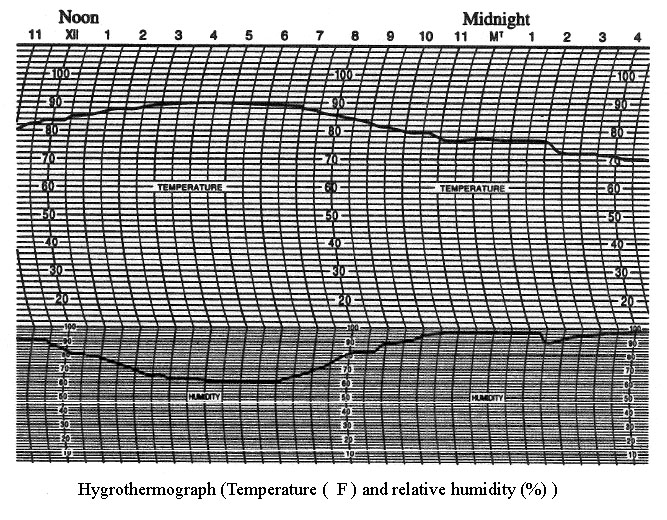
 A hygrothermograph is used by the weather services to record temperature and relative humidity (see figure labeled "Hygrothermograph") . The lower part of the graph is used to measure relative humidity from 0% to 100%. The upper part of the graph is used to measure temperature from 10° F to 110° F. What was the highest temperature recorded? Use the data in the figure to answer this question.
Definitions:
Natural Ecosystems
Communities of living organisms in conjunction with the nonliving components of their environment, interacting as a system.
Introducing New Species
The act of bringing a species into an ecosystem where it does not naturally occur, potentially disrupting local ecosystems.
Population Change Curve
A graph that shows how the size of a population changes over time.
Volatile
Characterized by rapid and unpredictable changes or fluctuations, often used to describe chemical substances that easily vaporize at normal temperatures or financial markets prone to rapid changes.
Q8: Find 53% of 360<sup>o</sup> Round your answer
Q14: Identify the independent and dependent variables
Q36: Read the measurement shown on the U.S.
Q52: Read the measurement shown on the U.S.
Q73: Find the equation of the line
Q76: Use the figure below to answer the
Q95: Identify the independent and dependent variables
Q98: Read the measurement shown on the metric
Q119: Let <span class="ql-formula" data-value="n"><span class="katex"><span
Q151: A survey of 100 families was