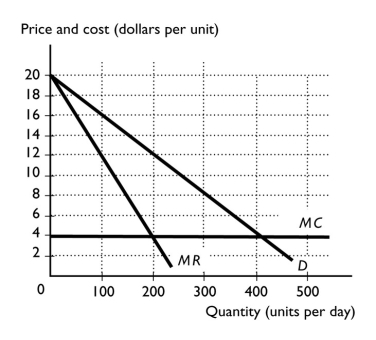
-The figure above shows the market demand curve for a market with three firms.It also shows a firm's marginal cost curve.In this oligopoly,what is the range of output and prices? Why does this range of outcomes exist?
Definitions:
Group Profits
The combined earnings of a conglomerate or group of companies under a single parent corporation.
Price Conspiracy
An illegal agreement among competitors to fix prices, control market production, or divide markets to eliminate competition and harm consumers.
Monopoly Market
A market structure characterized by a single seller offering a unique product or service with no close substitutes.
Herfindahl-Hirschman Index
An indicator used to assess the degree of market concentration and establish the intensity of industry competition.
Q22: The table shows information for Jen's Gymnastics.Jen
Q35: An oligopoly created because of economies of
Q76: If the four-firm concentration ratio for the
Q81: Derived demand means that the demand for
Q82: How do the characteristics of perfect competition
Q123: Resale price maintenance can be illegal<br>A) under
Q169: What type of profit can a firm
Q179: The figure above shows the market demand
Q200: "A Nash equilibrium occurs when both parties
Q207: Briefly describe and discuss the different ways