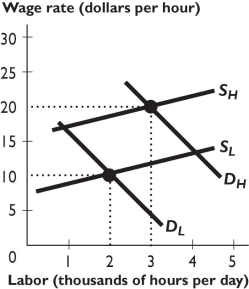
The figure above shows the demand and supply curves for high-skilled (indicated by an "H" subscript) and low-skilled (indicated by an "L" subscript) workers.
-In the figure above,the compensation for the cost of acquiring the skill creates the difference between the ________ curves and ________.
Definitions:
Q5: A natural resource is renewable if it<br>A)
Q5: What are the five boroughs of New
Q11: How has the industrialization of Quebec's economy
Q17: Based on the figure above,if the poorest
Q21: Discuss the patterns of urban settlement in
Q43: Which of the following are located in
Q45: In the figure above,the equilibrium wage differential
Q57: If a duopoly has reached the monopoly
Q77: A household's income earned from the markets
Q163: In order to spend more time with