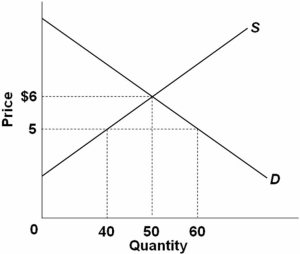
 Refer to the graph above.Over the $5-$6 range,the elasticity of supply using the midpoints formula is:
Definitions:
Average Revenue
The amount of revenue received per unit of a good or service sold, calculated by dividing total revenue by the total number of units sold.
Maximize Profits
Business objective to achieve the highest possible profit from operations and sales.
Minimize Losses
A strategy aimed at reducing the negative impacts or financial losses in operations, investments, or other activities.
Market Price
The current price at which a good or service can be bought or sold in a marketplace, determined through the supply and demand dynamics.
Q4: The law of diminishing returns explains why
Q5: Suppose that you could prepare your own
Q10: A competitive economy assumes each industry consists
Q13: Henry wants to buy a book.The economic
Q34: Which product is most likely to be
Q70: <img src="https://d2lvgg3v3hfg70.cloudfront.net/TB4893/.jpg" alt=" Refer to the
Q93: The data in the table show the
Q104: <img src="https://d2lvgg3v3hfg70.cloudfront.net/TB4893/.jpg" alt=" Refer to the
Q113: In the long run,pure competition forces firms
Q152: Which of the following constitutes an implicit