Multiple Choice
You have some data, which is shown in the graphic below. The two dimensions are X and Y, and the shade of each dot represents what class it is. You want to classify this data accurately using a linear algorithm. To do this you need to add a synthetic feature. What should the value of that feature be? 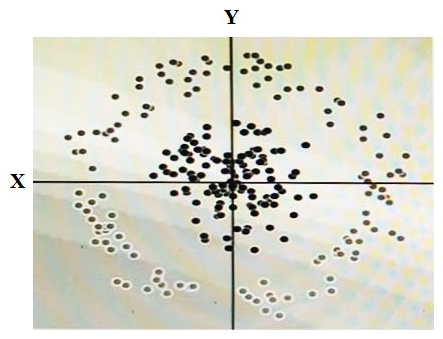
Definitions:
Related Questions
Q2: You need to set up a way
Q17: Your company has created an application that
Q25: You are using a third-party next-generation firewall
Q37: Your company's development teams want to use
Q50: Your company has sales offices in Madrid,
Q60: GK according to the called number parsing
Q102: What are two of the benefits of
Q148: Huawei video equipment can achieve stable level
Q238: You are creating a new pipeline in
Q262: FTP and TFTP can be used to