Refer to the figure.
Figure 1
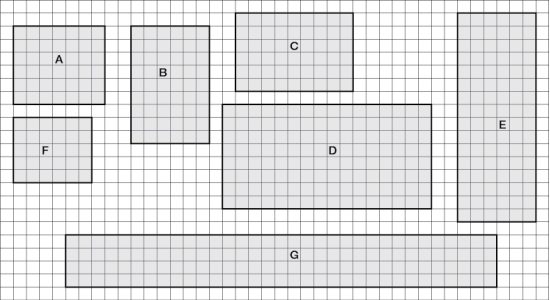 You are working with a town to develop a conservation strategy for parks (tracts) of protected land in a suburban area (parks A-G). These seven areas are depicted in Figure 1. Each square in the grid indicates an area of 1 km2.
- Refer to Figure 1 to familiarize yourself with the key aspects of the protected areas. Suppose the parks are susceptible to edge effects in the form of increased air temperature. Air temperature penetrates 1 km into the parks. Areas of the park that are more than 1 km from an edge are unaffected, and air temperature does not increase in those areas.Answer the following questions:
a) Using Figure 1, create a new figure (this will be referred to as Figure 2) indicating the locations within each of the parks that would be affected by edge effects.
b) Summarize how this edge effect would affect each of the parks (A-G) by creating a table (this will be referred to as Table 2). Based on the size (km2) of each park and the edge effects you sketched for Figure 2, determine for each park: 1) the area affected by increased air temperatures (in km2), and 2), based on the total area of each park and the area that would be affected by edge effects, the (%) of each park area affected by edge effect.
c) Which park would be most affected by edge effects in terms of total area affected? Which park would be most affected by edge effects in terms of percent of park area? Which park would be least affected by edge effects in terms of total area affected? Which park would be least affected by edge effects in terms of percent of park area?
Definitions:
Kinked Demand Curve
A demand curve in oligopoly market structures, characterized by a distinct bend or kink, indicating different elasticity above and below the current price.
Buying Power
The ability of consumers or businesses to purchase goods and services, influenced by income levels and the price of goods and services.
Monopoly
A commercial environment in which a sole vendor markets a one-of-a-kind product.
Perfect Competition
A market structure characterized by an infinite number of small firms, homogeneous products, perfect information, and no barriers to entry or exit.
Q2: For which purpose would a minirhizotron be
Q10: Discuss the four ethical principles of nursing.
Q21: What is the meaning of the statement:
Q29: What is a vulnerable population?
Q32: Which statement about the mammal fauna native
Q51: Bertness and Shumway's studies of high salt
Q54: Which statement regarding the oceanic pool of
Q65: Which statement about the global sulfur cycle
Q69: Refer to the figure.<br><img src="https://d2lvgg3v3hfg70.cloudfront.net/TBO1115/.jpg" alt="Refer to
Q70: According to the _ model of succession,