Refer to the figures.
Figure 1
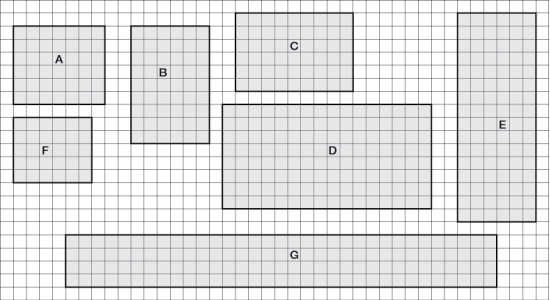 Figure 2
 You are working with a town to develop a conservation strategy for parks (tracts) of protected land in a suburban area (parks A-G). These seven areas are depicted in Figure 1. Each square in the grid indicates an area of 1 km2.
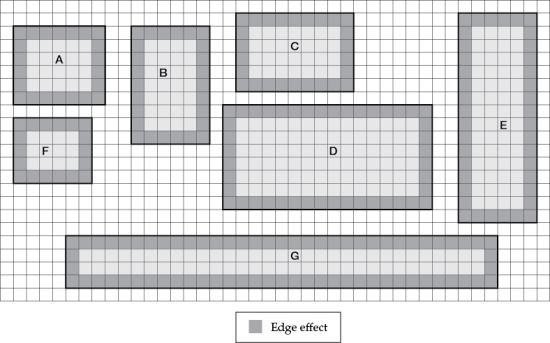
-Refer to Figure 1 to familiarize yourself with the key aspects of the protected areas. Suppose a species of bird lives in the parks in this area. These birds will fly among forest patches, but will only cross a maximum of 3 km of disturbed forest. The forest habitat that the birds require is disturbed by an edge effect that penetrates 1 km into the forest. Based on this information about the birds' movement preferences and the extent of edge effects, which patches could the birds move among? How many isolated populations of this bird species would you expect to find among the parks, and which parks would form each of the newly isolated populations? On Figure 2, circle the isolated populations (this will be referred to as Figure 4).
Definitions:
Supply Chain Management
The coordination and management of activities involved in making and delivering products from raw materials to final customers.
Value Chain Management
The process of managing activities and processes to add value to a product or service through efficient supply chain operations.
Customer Relationship Management
A strategy for managing an organization's interactions with current and future customers, typically using data analysis to study large amounts of information.
Break-even Analysis
A financial calculation to determine the point at which revenue received equals the costs associated with receiving the revenue, marking the point of no profit and no loss.
Q9: A bureaucratic organization has which of the
Q20: <br>Describe two ways that option 1 would
Q33: Which method(s) of estimating NPP is typically
Q36: Refer to the table.<br><img src="https://d2lvgg3v3hfg70.cloudfront.net/TBO1115/.jpg" alt="Refer to
Q40: Which statement about food webs is false?<br>A)
Q44: Refer to the figure.<br><img src="https://d2lvgg3v3hfg70.cloudfront.net/TBO1115/.jpg" alt="Refer to
Q55: The ability of the brain to be
Q61: Describe the discoveries that led scientists to
Q64: _ can be defined as a state
Q123: Which neuroanatomical method provides an outline of