Refer to the tables.
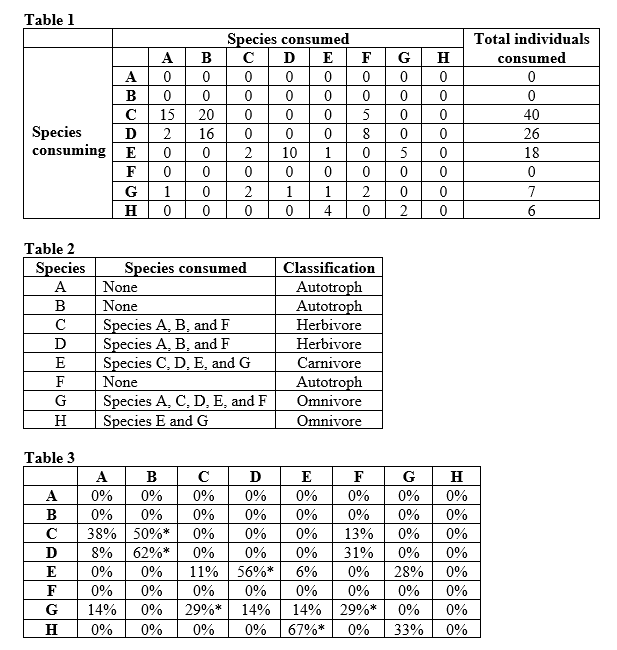 Using the data in Tables 1-3, construct a food web for your study area (this will be referred to as Figure 1). Separate trophic levels with horizontal lines and number each trophic level. Indicate the classification for the species in each trophic level (i.e., secondary consumers, etc.). Indicate each species on its appropriate trophic level. Finally, sketch arrows between the species names to indicate which species consume which other species. Arrows should start at the species that was consumed and point to the species that are consumers.
Definitions:
Ratio
A numerical relationship between two quantities showing how many times one value contains or is contained by the other.
Ordered
Arranged in a logical or sequential manner, often according to size, importance, or chronological occurrence.
Natural Zero
A value that inherently indicates the absence of a quantity or phenomenon, e.g., zero apples mean there are no apples.
Ratio Data
A type of quantitative data that not only allows for comparison of amounts but also involves a natural zero point, allowing for statements of multiplicity.
Q1: Which statement about foundation species is true?<br>A)
Q2: The part of the healthcare service bill
Q2: Which of the following is an example
Q7: Which statement about succession in the glaciers
Q9: For an ecological interaction to be a
Q18: What is the input of calcium into
Q43: Refer to the table.<br>Table 1<br> <img src="https://d2lvgg3v3hfg70.cloudfront.net/TBO1115/.jpg"
Q47: How did Brewer manipulate the level of
Q69: Suppose that the net secondary production in
Q71: Why is upwelling important for the commercial