Refer to the table.
Table 1
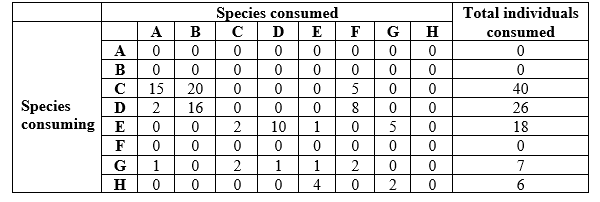 You are studying how energy flows in a food web. The data in Table 1 shows the dietary composition of species in your study area (for species A-H). To read the data table, start at a species in column 1, read to the right across that row to find the number of individuals consumed, then read straight up to determine the species that it consumed. For example, species C consumed 15 individuals of species A. In preparation for constructing a food web for your study area, you need to determine the dietary preferences of your species. For each species, quantify the percent of the total diet comprised by each of the species consumed. Enter your data into a table (this will be referred to as Table 3), and for each species, place an asterisk next to its most preferred prey. Why is this type of analysis helpful to conduct in preparation for constructing a food web diagram? Give two reasons and explain your answers.
Definitions:
Q9: In freshwater ecosystems, the presence of descending
Q31: Two species of birds feed on berries.
Q34: Which scientist conceptualized Earth as divided into
Q37: Which statement about habitat corridors is false?<br>A)
Q39: Refer to the map.<br><img src="https://d2lvgg3v3hfg70.cloudfront.net/TBO1115/.jpg" alt="Refer to
Q45: Refer to the table.<br><img src="https://d2lvgg3v3hfg70.cloudfront.net/TBO1115/.jpg" alt="Refer to
Q46: You are in Glacier Bay. Starting at
Q50: Cougars prey on both white-tailed deer and
Q59: In some ecosystems, NPP actually decreases at
Q66: <br>Based on these equations, what is the