Refer to the table and the figure.
Table 2
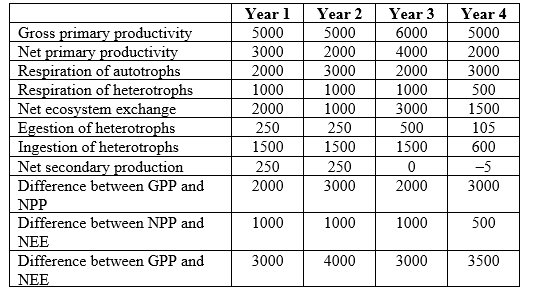 Figure 1
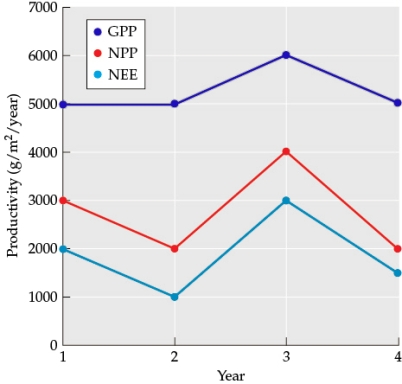 You are studying the movement of energy through an ecosystem.
-You collect data on energy use at the same site across four years, measured in g/m2/year. Assume that the site is sampled at the same location on the same date each year. How did energy production and/or use change when comparing year 1 and year 2? What effect did these changes have on the relationship between GPP, NPP, and NEE?
Definitions:
Rain Forests
Tropical forests characterized by high rainfall, with annual rainfall between 1750 and 2000 mm.
Sea Surface Temperatures
The temperature of the surface layer of the ocean, a key factor affecting climate and weather patterns globally.
Oceans
Large bodies of saltwater that cover approximately 71% of the Earth's surface, playing a critical role in climate regulation and supporting diverse marine life.
Thermohaline Conveyor
A mostly deep-water ocean current driven by density differences that are caused by variations in temperature and salinity.
Q3: Which statement about the nitrogen cycle is
Q4: All nutrients are ultimately derived from<br>A) minerals
Q5: For any given species or larger taxonomic
Q9: What does belonging to a professional nursing
Q34: Alternative stable states most often arise<br>A) in
Q37: Thomas Park's studies of flour beetles and
Q47: In the studies by Hacker and Gaines
Q47: Refer to the figure.<br><img src="https://d2lvgg3v3hfg70.cloudfront.net/TBO1115/.jpg" alt="Refer to
Q49: Refer to the figure.<br><img src="https://d2lvgg3v3hfg70.cloudfront.net/TBO1115/.jpg" alt="Refer to
Q59: Competitive exclusion states that two organisms cannot