Refer to the table and the figure.
Table 2
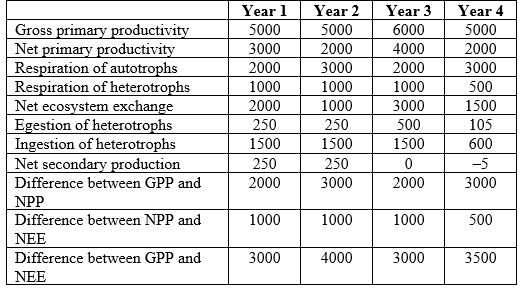 Figure 1
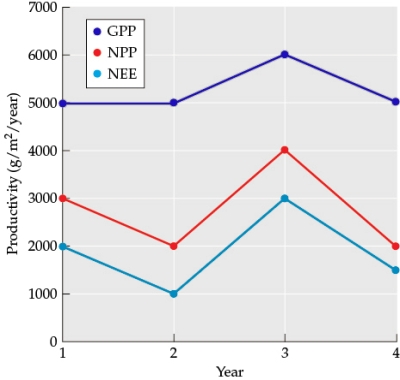 You are studying the movement of energy through an ecosystem. You collect data on energy use at the same site across four years, measured in g/m2/year.
-Assume that the site is sampled at the same location on the same date each year.Answer the following questions:
a) In which year was GPP the highest?
b) Were NPP and NEE also highest when GPP was highest?
c) In which year was GPP the lowest?
d) Were NPP and NEE also lowest when GPP was lowest?
e) In which year was the difference between GPP and NPP the greatest?
f) In which year was NEE the smallest?
Definitions:
Wire Gauge
A measure of the thickness of a wire, often used in determining current capacity or electrical resistance.
Diameter
Straight line extending across the center of a circle from circumference to circumference. The diameter of a circle is two times its radius.
Potential Difference
The difference in electric potential between two points, which drives the flow of electric current in a circuit.
Q10: Which of the following is an example
Q11: Suppose that a species of moss cannot
Q15: The vaquita, a tiny marine porpoise, is
Q18: Large-scale community changes observed historically took
Q22: What did John Martin mean when he
Q45: In the symbiotic relationships among the organisms
Q52: Refer to the figure.<br><img src="https://d2lvgg3v3hfg70.cloudfront.net/TBO1115/.jpg" alt="Refer to
Q62: Decreases in _ tend to increase the
Q63: Use inequalities generated by the Lotka-Volterra
Q73: What would be the mean residence time