Refer to the table and the figure.
Table 2
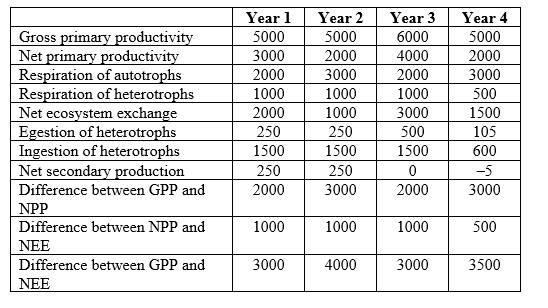 Figure 1
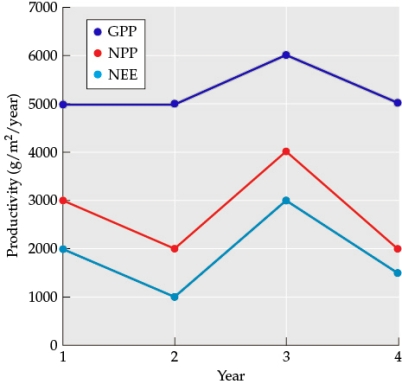
-You are studying the movement of energy through an ecosystem. You collect data on energy use at the same site across four years, measured in g/m2/year. Assume that the site is sampled at the same location on the same date each year. Compare net secondary production in year 3 with year 2. How did net secondary production change? What might have driven this change?
Definitions:
Q8: Which government body developed Healthy People 2020?<br>A)
Q12: In his studies of ecosystems in the
Q22: <br>What effect would option 3 (fertilizing ocean
Q29: Refer to the figure.<br><img src="https://d2lvgg3v3hfg70.cloudfront.net/TBO1115/.jpg" alt="Refer to
Q36: Black walnut trees release chemicals that can
Q50: According to studies by Dambrine and colleagues,
Q59: According to the data in Figure
Q62: Plant species from resource-_ environments often have
Q68: Use inequalities generated by the Lotka-Volterra
Q68: This vegetation reconstruction shows major shifts