Refer to the table and the figure.
Table 2
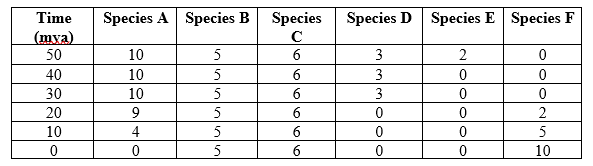 Figure 4
 You are studying the long-term effects of plate movement for two land masses, land mass A and land mass B. Your goal is to understand how land mass movement has affected the species found on each land mass. Land mass B joined with land mass A 30 million years ago. Table 2 shows the number of individuals of each species (species A-F) found living on land mass B over time. Figure 4 shows these data plotted.
- Use the data in Table 2 and Figure 4 to answer the following questions:
a) Create a line graph of the species richness of land mass B over time (this will be referred to as Figure 6). The x-axis should be time in mya, ranging from 50-0 mya, and the y-axis should be species richness, ranging from 0-6.
b) What was the overall effect of the joining of land masses A and B on the species richness of land mass B?
c) Describe the similarities and differences in the patterns of change in species richness and composition through time.
Definitions:
Group Development
The process through which a group progresses through stages of formation, storming, norming, performing, and adjourning to achieve effectiveness and cohesion.
Autocratic Leader
A leadership style where decision-making is centralized in the leader, often without input or consultation from others.
Participative Leader
A leadership style characterized by involving team members in decision-making processes and valuing their input.
Consultative Leader
A leadership style where the leader seeks input from team members before making decisions, emphasizing collaboration and advice.
Q1: All other things being equal, herbivores generally
Q5: Which statement about Huston's dynamic equilibrium model
Q26: If herbivores eat 320 kg of plants,
Q28: In the succession that followed the eruption
Q29: Suppose a fish species lives in an
Q40: Population viability analysis (PVA) is useful for
Q43: Compare past and present extinction rates, and
Q45: The grizzly bear has habitat requirements that
Q59: The interaction of fig trees and fig
Q75: In Paine's studies of the rocky intertidal