Refer to the tables and the figure.
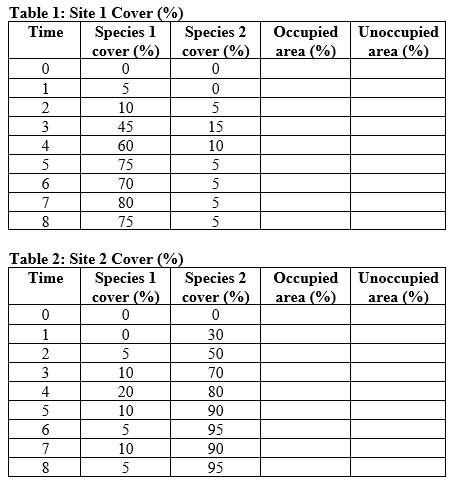 Figure 10
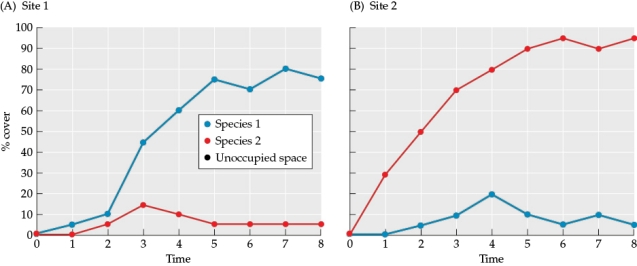 You are studying succession and colonization at two sites, site 1 and site 2. You sample the abundance of two species at the sites and determine their percent cover at each site and time period. Your data are shown in Tables 1 and 2 and are graphed in Figure 10.Answer the following questions:
a) Based on percent cover of species 1 and species 2 at each site, determine the percent of space that is both occupied and unoccupied at each site for each time period. Enter the data into Tables 1 and 2 to create two new tables (these will be referred to as Tables 3 and 4).
b) Using the data in Tables 1 and 2, add lines to the graphs in Figure 10 to plot how the percent of unoccupied space changed over time at both sites (this will be referred to as Figure 11).
c) Using the data in Figure 10, create a table (this will be referred to as Table 5) with summary data on each site. Answer each question for each site.
• How much biomass was present at time 0?
• Which species was the earlier colonist?
• What type of succession occurred early in the study period?
• Which species is dominant at time 8?
• When is the total amount of available area fully utilized by the species at each site?
Definitions:
Threats
External or internal factors perceived to cause potential harm or danger to individuals or groups.
Rough-And-Tumble Play
Social interaction involving chasing and play fighting with no intent to harm.
Aggression
Behavior intended to harm or intimidate others, which can be physical, verbal, or psychological.
Play Face
A facial expression often observed in primates, including humans, indicating a desire to play, characterized by open mouth and relaxed features.
Q8: According to the Menge-Sutherland model, predation affects
Q27: How does the protein transferrin assist in
Q30: Refer to the figure.<br><img src="https://d2lvgg3v3hfg70.cloudfront.net/TBO1115/.jpg" alt="Refer to
Q38: Which principle is best supported by the
Q51: Climate change is predicted to have wide-ranging
Q53: Use the following simple predator-prey relationships to
Q57: A fundamental niche<br>A) is always the same
Q64: Use the data in Table 1 and
Q65: You are studying a population of a
Q73: What would be the mean residence time