Refer to the tables and the figure.
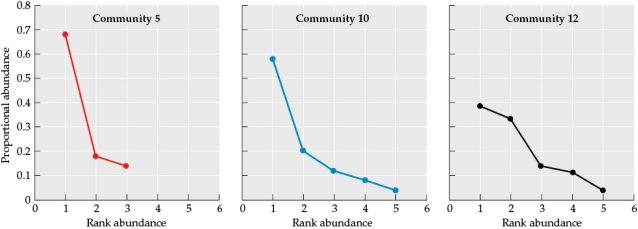
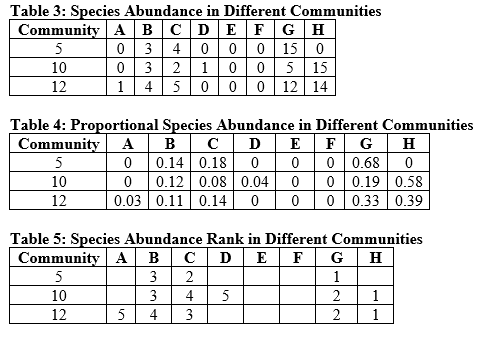 Figure 3
 Suppose you are researching an ecological community in a new study area. You divide your study area into quadrats and sample one quadrat a day to determine the species that occupy the area and how many individuals of these species are present. Assume that by the end of your sampling efforts, you have identified all of the species that occur in the study area. Use Tables 3, 4, and 5 as well as Figure 3 to answer the following questions:
a) Which species is most common in each community?
b) Which species is the rarest in each community?
c) Are the same species always common and always rare, or is there variation?
d) How are communities 5 and 10 similar? How do they differ? Consider species composition, proportion, abundance, and richness in your answer.
e) How are communities 10 and 12 similar? How do they differ? Consider species composition, abundance, and richness in your answer.
Definitions:
FLACC Tool
A behavioral scale used to assess pain in children who are unable to verbally communicate, considering factors like facial expression, leg movement, activity, cry, and consolability.
FACES Pain Rating
A visual scale for assessing pain intensity, often using faces ranging from smiling (no pain) to crying (worst pain).
Numeric Scale
A sequence of numbers used to measure or rate the level of something, such as pain.
Oucher Scale
A pain rating scale designed for children, using photographs and numerical scales to quantify pain intensity.
Q1: In Brown and Davidson's study of seed-eating
Q7: Which statement about succession in the glaciers
Q8: The final theoretical stage of succession is
Q10: In the dunes near Lake Michigan studied
Q15: Refer to the figure.<br><img src="https://d2lvgg3v3hfg70.cloudfront.net/TBO1115/.jpg" alt="Refer to
Q26: Two species of birds actively fight over
Q39: Based on examples from the text, which
Q42: Which of the following is one example
Q68: Eutrophication occurs when<br>A) there is a decrease
Q69: Refer to the figures.<br><img src="https://d2lvgg3v3hfg70.cloudfront.net/TBO1115/.jpg" alt="Refer to