Refer to the table and the figure.
Table 10
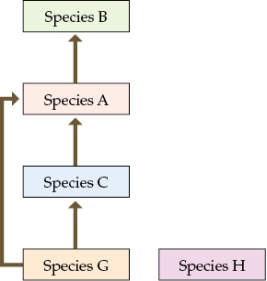
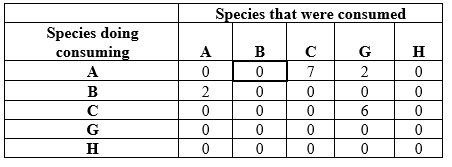 Figure 5
Food web in year 12
 Suppose you are researching an ecological community in a new study area. You divide your study area into quadrats and sample one quadrat a day to determine the species that occupy the area and how many individuals of these species are present. Assume that by the end of your sampling efforts, you have identified all of the species that occur in the study area. You collect additional information on how biomass is transferred through your study system by determining the dietary components of each species during year 12 of your study. Table 10 shows the numbers of individuals that each other individual consumed during year 12. To read the data table, start at a species in column 1, read to the right across that row to find the number of individuals consumed, then read up to determine the species that it consumed. For example, species A consumed 0 individuals of species B (data cell outlined in bold). Refer to the data in Table 10 to understand the structure of the food web in the community in year 12.Answer the following questions:
a) What role does species H play in the community in Year 12?
b) Based on Figure 5, how should the loss of species G impact community structure in year 15? Does this differ from the original observed data? What do you think caused the difference in the observed species composition for year 15, and what would you have predicted based on the food web data? If you collected data on the food web in year 15, what differences would you expect from the structure of the food web at year 12? What additional information would be needed to construct a complete food web at year 15?
Definitions:
Character
The totality of an individual's ethical and moral qualities, reflecting their integrity, honesty, and personal values.
Integrity
The quality of being honest and having strong moral principles, or the state of being whole and undivided.
Role Modeling
The process in which individuals influence others by serving as examples or patterns of behavior for them to emulate.
Proper Behavior
Conduct that is regarded as socially acceptable or appropriate in a given situation or environment.
Q2: Which statement about logistic growth is false?<br>A)
Q11: Allstadt et al. (2013) found that population
Q17: In the simple host-pathogen model, which
Q25: An insect removes nectar from a flower
Q27: Which statement about Arcese and Smith's studies
Q34: Which statement about parasitoids is false?<br>A) Most
Q51: The country of Guatemala is currently experiencing
Q54: Witman's studies of marine invertebrate communities demonstrated
Q54: Which of the following could be considered
Q65: Spider crabs live on the ocean floor