Refer to the figure.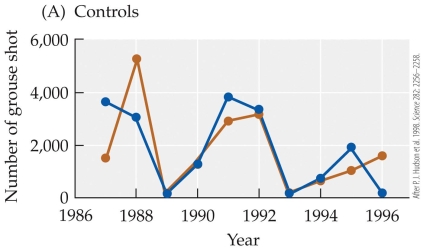
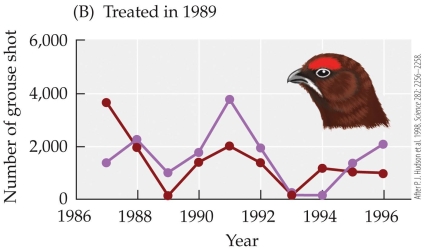
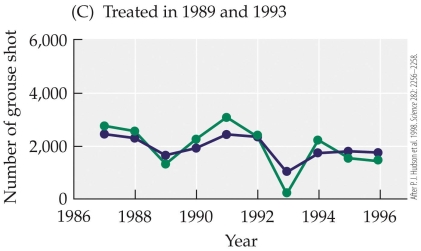 The figure shows results from a study by Hudson and colleagues on red grouse and their nematode parasite. The figures show the cycling of six red grouse populations subjected to three treatments: (A) two control populations, (B) two populations treated for nematode parasites in 1989, and (C) two populations treated for parasites in 1989 and 1993. Each of the six grouse populations is designated by a different color. These results show that removal of the parasite
Definitions:
Q4: Refer to the figure.<br><img src="https://d2lvgg3v3hfg70.cloudfront.net/TBO1115/.jpg" alt="Refer to
Q11: Suppose that a species of moss cannot
Q12: Which statement is not an assumption of
Q18: Which classification scheme or metric is generally
Q19: Mountain gorillas put a lot of effort
Q28: The figure shows the changes associated
Q33: According to the figure, the bacterial symbiont<br>A)
Q43: Adult monarch butterflies overwinter<br>A) eastern North America.<br>B)
Q51: According to the table, the relationship between
Q62: Tall people generally have tall parents, and