Refer to the figure.
Figure 1
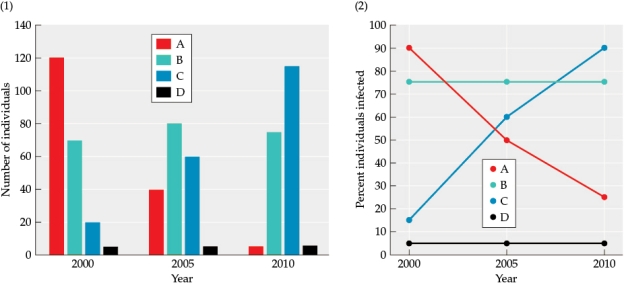 The figure shows data collected on a species of fish that lives on a coral reef. The fish were captured and studied three times-in 2000, 2005, and 2010. Four genotypes were found in an area of the coral reef (shown as A, B, C, and D). The figure shows: (1) the number of individuals of each genotype captured during each year, and (2) the percent of individuals infected with parasites captured during each year.
-Answer the following questions:
a) How does population size change over time for each of the four genotypes?
b) How does the percent of infected individuals change over time for each of the four genotypes?
c) Based on the percent of infected individuals of each genotype in each year, calculate the numbers of infected individuals. Create a new graph (this will be referred to as Figure 2) that reflects this data using the Figure 1 left, with each column reflecting a height that indicates the number of infected individuals.
d) What is the average infection rate across all genotypes for each study year? Create another new graph (this will be referred to as Figure 3) that reflects this data using Figure 1 right. Use an asterisk (*) to indicate the average infection rate for each year. Next, calculate the average of the average infection rate and add this data to the graph as a horizontal dotted line
Definitions:
Surplus Labor
The portion of the labor force that exceeds the amount of labor needed to produce a given level of output, often leading to unemployment.
Capital-Saving Investment
Investments made to increase efficiency or reduce the capital required for production without reducing output.
Technological Advance
It refers to the development and application of new technologies and innovation, which can improve efficiency, productivity, and capabilities in various sectors.
Per Capita Outputs
The average output produced per person in a given area or country, often used as a measure of productivity or economic performance.
Q12: Refer to the figure.<br><img src="https://d2lvgg3v3hfg70.cloudfront.net/TBO1115/.jpg" alt="Refer to
Q22: What is the most likely reason that
Q24: Which of the following should reduce
Q29: Which characteristic best distinguishes microparasites from macroparasites?<br>A)
Q31: Eberhard's study of spiders and their parasitoid
Q31: When did the world population first reach
Q39: Which statement about competition is false?<br>A) Exploitation
Q52: Which statement about change in communities is
Q60: Which statement about tuberculosis (TB) is false?<br>A)
Q60: Suppose you wanted to determine whether you