Refer to the figure.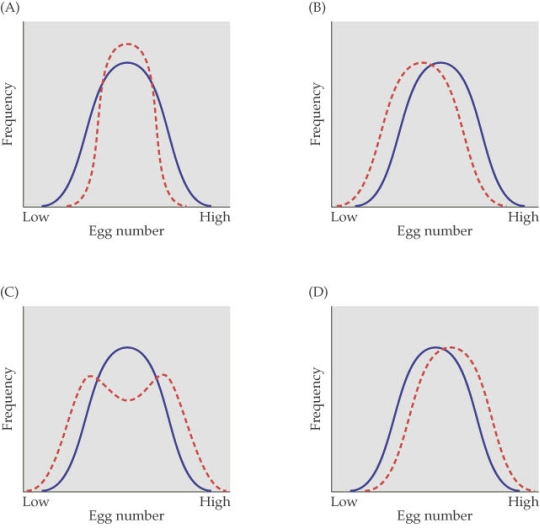
- The figure shows four cases of selection on egg number in a population of flour beetles. The solid blue line represents the frequency of the original population and the dashed red line represents the frequency distribution after eight generations. In which figure did the variance within the population for egg laying increase the most?
Definitions:
Q5: Refer to the figures.<br>Figure 1<br> <img src="https://d2lvgg3v3hfg70.cloudfront.net/TBO1115/.jpg"
Q7: Which statement about species geographic ranges is
Q16: A population of blowflies experiences logistic growth
Q29: A species of turtle grows for several
Q32: The blue bars show the average body
Q45: El Niño events are associated with<br>A) greatly
Q46: <br>The table shows the survivorship, fecundity, and
Q49: Some species in the genus Clusia start
Q49: Which of the following is not a
Q79: Refer to the figure.<br><img src="https://d2lvgg3v3hfg70.cloudfront.net/TBO1115/.jpg" alt="Refer to